Step Area Chart [Deprecated]
Step area chart is derived from area chart. Use step area chart to show periods without change and show the exact time of each change within a trend.
Simply locate Bunifu Dataviz control in your toolbox and drag it to the location on your form where you would like to display it.
We will use button click event handler to display our chart called render_step_area
private void render_step_area_Click(object sender, EventArgs e)
{
var r = new Random();
var canvas = new Bunifu.Dataviz.WinForms.BunifuDatavizBasic.Canvas();
var datapoint = new Bunifu.Dataviz.WinForms.BunifuDatavizBasic.DataPoint(
Bunifu.Dataviz.WinForms.BunifuDatavizBasic._type.Bunifu_stepArea);
datapoint.addLabely("SUN", r.Next(0, 100).ToString());
datapoint.addLabely("MON", r.Next(0, 100).ToString());
datapoint.addLabely("TUE", r.Next(0, 100).ToString());
datapoint.addLabely("WED", r.Next(0, 100).ToString());
datapoint.addLabely("THU", r.Next(0, 100).ToString());
datapoint.addLabely("FRI", r.Next(0, 100).ToString());
datapoint.addLabely("SAT", r.Next(0, 100).ToString());
// Add data sets to canvas
canvas.addData(datapoint);
//render canvas
bunifuDataViz1.Render(canvas);
}
VB.NET code
Private Sub render()
Dim canvas As Bunifu.Dataviz.WinForms.BunifuDatavizBasic.Canvas = New Bunifu.Dataviz.WinForms.BunifuDatavizBasic.Canvas()
Dim datapoint1 As Bunifu.DataViz.WinForms.DataPoint
bunifuDataViz1.colorSet.Add(Color.Black)
datapoint1 = New Bunifu.Dataviz.WinForms.BunifuDatavizBasic.DataPoint(Bunifu.Dataviz.WinForms.BunifuDatavizBasic._type.Bunifu_stepArea)
Dim random As Random = New Random()
datapoint1.addLabely("MON", random.[Next](0, 50).ToString())
datapoint1.addLabely("TUE", random.[Next](0, 50).ToString())
datapoint1.addLabely("WED", random.[Next](0, 50).ToString())
datapoint1.addLabely("THU", random.[Next](0, 50).ToString())
datapoint1.addLabely("FRI", random.[Next](0, 50).ToString())
datapoint1.addLabely("SAT", random.[Next](0, 50).ToString())
datapoint1.addLabely("SUN", random.[Next](0, 50).ToString())
canvas.addData(datapoint1)
bunifuDataViz1.Renderint2))
End Sub
In order to display step area chart we need the following controls:
- Bunifu Data Viz - This is the container for our chart
- Bunifu Canvas - This is the middle layer between the data viz (container) and the dataset
- Bunifu Data Point - This will contain the data that we want to represent as pairs of X and Y coordinates
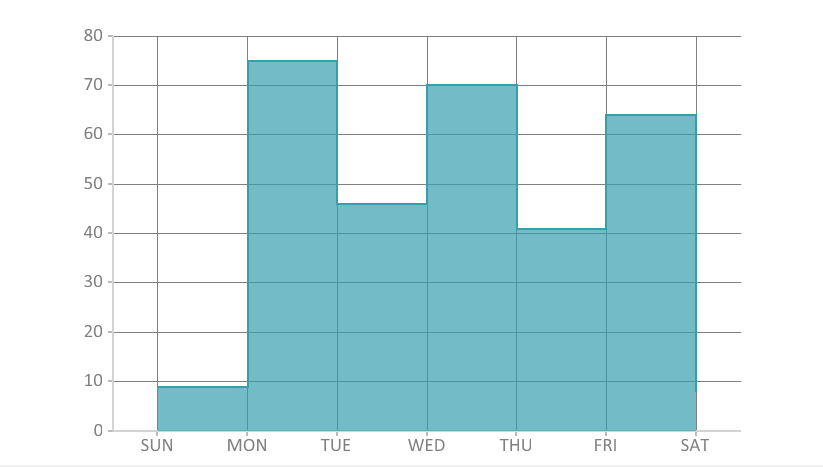
On running the code you should see something like this:

That's it!
We hope Bunifu Dataviz will help you bring out the best data visualization for your data in your application.
Should you have feedback or suggestions please send us via chat on the bottom right corner of the screen.
Last modified 2yr ago