Bunifu Framework Docs
HomePricingFAQsMy Account
  • Introduction
  • Getting started
    • Requirements
    • Installation
    • Installing for .Net 5 & Above
    • Licensing
      • Managing your licenses
      • Bunifu Licensing CLI
      • Bunifu Device Remover (Deprecated)
  • BUNIFU UI
    • Controls
      • Bunifu Button
      • Bunifu Button (variant)
      • Bunifu Cards
      • Bunifu CheckBox
      • Bunifu Circle Progress
      • Bunifu Datagrid View
      • Bunifu Date Picker
      • Bunifu Drop Down
      • Bunifu Flat Button
      • Bunifu Form Caption Button
      • Bunifu Form Control Box
      • Bunifu Form Resize Icon
      • Bunifu Gradient Panel
      • Bunifu Icon Button
      • Bunifu Image Button (New)
      • Bunifu Image Button (Old)
      • Bunifu IOS Switch (1.5.3)
      • Bunifu Label
      • Bunifu Loader
      • Bunifu Picture Box
      • Bunifu Pages
      • Bunifu Panel
      • Bunifu Progress Bar
      • Bunifu Radial Gauge
      • Bunifu Radio Button
      • Bunifu Rating
      • Bunifu Range
      • Bunifu Separator
      • Bunifu Sliders
      • Bunifu Shadow Panel
      • Bunifu Shapes
      • Bunifu Switch (1.5.3)
      • Bunifu ScrollBars
      • Bunifu Toggle Switch
      • Bunifu Toggle Switch (variant)
      • Bunifu Tile Button
      • Bunifu Thin Button (1.5.3)
      • Bunifu ToolTip
      • Bunifu Textbox
      • Bunifu User Control
    • Components
      • Bunifu Color Transition
      • Bunifu Drag
      • Bunifu Elipse [Deprecated]
      • Bunifu Form Dock
      • Bunifu Form Drag
      • Bunifu Form Resizer
      • Bunifu Snackbar
      • Bunifu Transition
  • BUNIFU CHARTS
    • Introduction
      • Quick Tips
    • Chart Components
      • Bunifu Bar Chart
      • Bunifu Bubble Chart
      • Bunifu Canvas Control
      • Bunifu Doughnut Chart
      • Bunifu Horizontal bar Chart
      • Bunifu Line Chart
      • Bunifu Pie chart
      • Bunifu Polar Chart
      • Bunifu Radar Chart
  • BUNIFU DATAVIZ [Deprecated]
    • Basic Charts [Deprecated]
      • Step Line Chart [Deprecated]
      • Step Area Chart [Deprecated]
      • Spline Chart [Deprecated]
      • Pie Chart [Deprecated]
      • Line Chart [Deprecated]
      • Doughnut Chart [Deprecated]
      • Bar Chart [Deprecated]
      • Area Chart [Deprecated]
      • Column Chart [Deprecated]
    • Advanced Charts [Deprecated]
      • Stacked Column 100 Chart [Deprecated]
      • Stacked Column Chart [Deprecated]
      • Stacked Bar Chart 100 [Deprecated]
      • Stacked Bar Chart [Deprecated]
      • Stacked Area Chart 100 [Deprecated]
      • Stacked Area Chart [Deprecated]
      • Scatter Chart [Deprecated]
      • Range Spline Area Chart [Deprecated]
      • Range Column Chart [Deprecated]
      • Range Bar Chart [Deprecated]
      • Range Area Chart [Deprecated]
      • OHLC Chart [Deprecated]
      • Candle Stick Chart [Deprecated]
      • Bubble Chart [Deprecated]
Powered by GitBook
On this page

Was this helpful?

  1. BUNIFU DATAVIZ [Deprecated]
  2. Advanced Charts [Deprecated]

Range Bar Chart [Deprecated]

Range bar chart is used to display the difference between high and low values over a period or time or comparing data among categories.

How to display range bar chart using Bunifu Dataviz

Simply locate Bunifu Dataviz control in your toolbox and drag it to the location on your form where you would like to display it.

We will use button click event handler to display our chart called render_rangebar.

C# code

private void render_rangebar_stick()
{   
    
    var canvas = new Bunifu.Dataviz.WinForms.BunifuDatavizAdvanced.Canvas();   
    var datapoint = new Bunifu.Dataviz.WinForms.BunifuDatavizAdvanced.DataPoint(Bunifu.Dataviz.WinForms.BunifuDatavizAdvanced._type.Bunifu_rangeBar);   
    
    datapoint.addxy("new Date (2002,11,10)", new JArray(16.23, 17.99).ToString());   
    datapoint.addxy("new Date (2002, 11, 9)", new JArray(15.95, 19.25).ToString());   
    datapoint.addxy("new Date (2002, 11, 8)", new JArray( 11.30, 16.88).ToString());   
    datapoint.addxy("new Date (2002, 11, 7)", new JArray( 13.29, 14.28).ToString());   
    datapoint.addxy("new Date (2002, 11, 6)", new JArray( 15.23, 16.45).ToString());   
    datapoint.addxy("new Date (2002, 11, 5)", new JArray( 13.70, 16.50).ToString());   
    datapoint.addxy("new Date (2002, 11, 4)", new JArray( 17.50, 19.00).ToString());   
    datapoint.addxy("new Date (2002, 11, 3)", new JArray( 19.50, 20.85).ToString());   
    datapoint.addxy("new Date (2002, 11, 2)", new JArray( 20.07, 21.44).ToString());   
    datapoint.addxy("new Date (2002, 11, 1)", new JArray( 25.00, 26.70).ToString());   
    
    // Add data set to canvas   
    canvas.addData(datapoint); 
      
    //render canvas   
    bunifuDataViz1.Render(canvas); 
    
}
Private Sub render_rangebar() 

  Dim canvas as New Bunifu.Dataviz.WinForms.BunifuDatavizAdvanced.Canvas;   
  Dim datapoint as Bunifu.Dataviz.WinForms.BunifuDatavizAdvanced.DataPoint = New Bunifu.Dataviz.WinForms.BunifuDatavizAdvanced.DataPoint (Bunifu.Dataviz.WinForms.BunifuDatavizAdvanced._type.Bunifu_rangeBar);   
  
  datapoint.addxy("new Date (2002,11,10)", new JArray(16.23, 17.99).ToString());   
  datapoint.addxy("new Date (2002, 11, 9)", new JArray(15.95, 19.25).ToString());   
  datapoint.addxy("new Date (2002, 11, 8)", new JArray(11.30, 16.88).ToString());   
  datapoint.addxy("new Date (2002, 11, 7)", new JArray(13.29, 14.28).ToString());   
  datapoint.addxy("new Date (2002, 11, 6)", new JArray( 15.23, 16.45).ToString());   
  datapoint.addxy("new Date (2002, 11, 5)", new JArray(13.70, 16.50).ToString());   
  datapoint.addxy("new Date (2002, 11, 4)", new JArray(17.50, 19.00).ToString());   
  datapoint.addxy("new Date (2002, 11, 3)", new JArray(19.50, 20.85).ToString());   
  datapoint.addxy("new Date (2002, 11, 2)", new JArray(20.07, 21.44).ToString());   
  datapoint.addxy("new Date (2002, 11, 1)", new JArray(25.00, 26.70).ToString());      
  
  // Add data set to canvas   
  canvas.addData(datapoint);  
    
  //Render the canvas in the Data Viz    
  bunifuDataViz1.Render(canvas); 

End Sub 

In order to display range bar chart we need the following controls:

  • Bunifu Data Viz - This is the container for our chart

  • Bunifu Canvas - This is the middle layer between the data viz (container) and the dataset

  • Bunifu Data Point - This will contain the data that we want to represent as pairs of X and Y coordinates

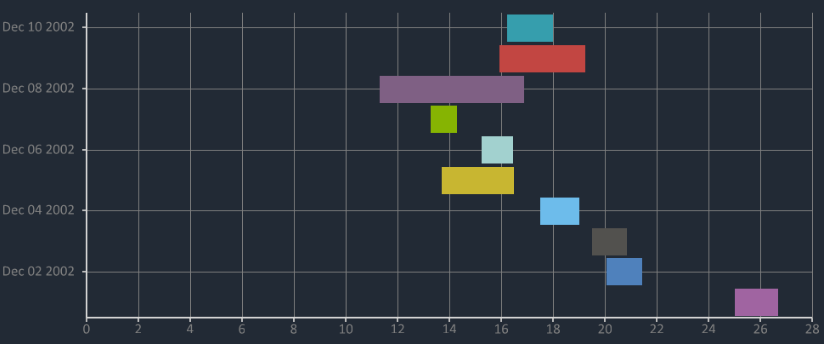
How Bunifu Range Bar Chart works is pretty simple: we populate the Bunifu Datapoint control with “points”, described by the Y coordinate (the first parameter of the addxy method) and an array of 2 coordinates, specifying the limits of the line that we want to represent.

On running the code you should see something like this:

That's it!

We hope Bunifu Dataviz will help you bring out the best data visualization for your data in your application.

Should you have feedback or suggestions please send us via chat on the bottom right corner of the screen.

PreviousRange Column Chart [Deprecated]NextRange Area Chart [Deprecated]

Last updated 4 years ago

Was this helpful?